比如可以用:http://www.yamllint.com/
如果不小心用了tab符号, 肉眼是看不出的。 但是会被检测出来:
found a tab character that violate indentation while scanning a plain scalar at line 74 column 11
比如可以用:http://www.yamllint.com/
如果不小心用了tab符号, 肉眼是看不出的。 但是会被检测出来:
found a tab character that violate indentation while scanning a plain scalar at line 74 column 11
JB’s dot trace performance profiler is part of its dot ultimate suite(which includes the famous resharper)
the simplest way to use it is to attach to your already running process(the same setting can be reused next time), and check the “collect profiling data from start”, then hit run before the slow performance happens, then take a snapshot as soon as the slowness ends.
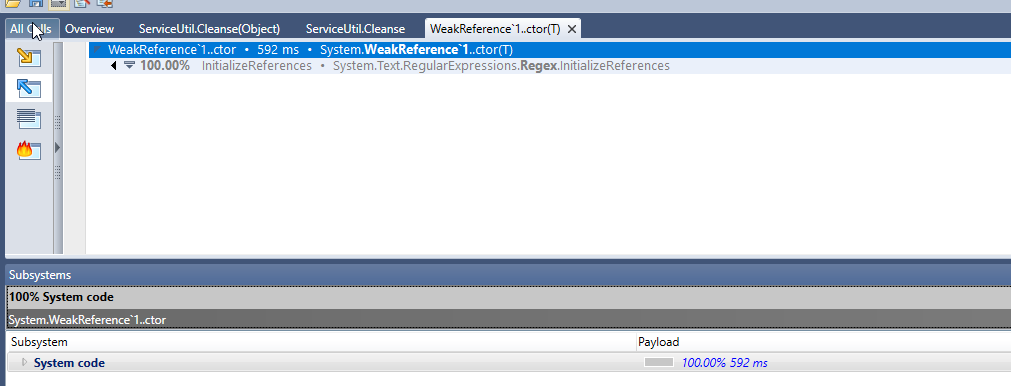
then go to the hot spots or just functions list, order by time.
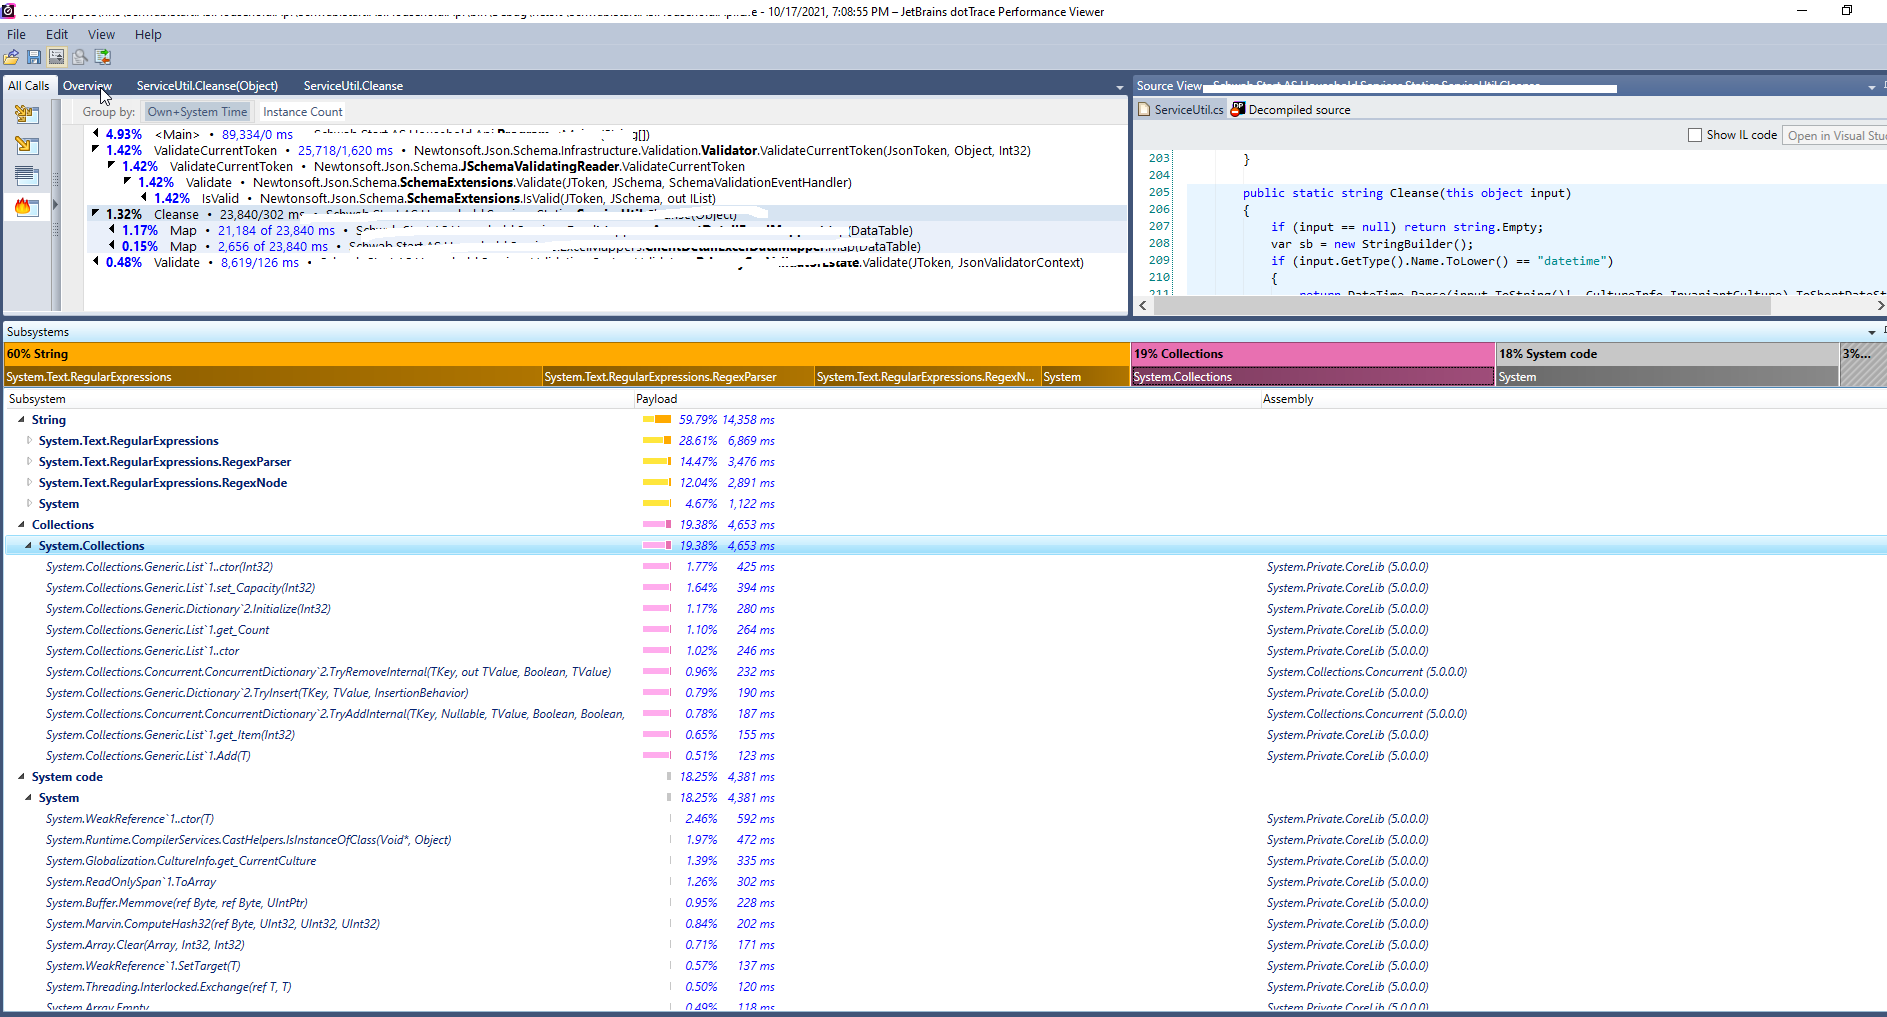
it will give you where the slowness happened, and even system code that ran slow can be dug into who called them.
then you can use https://benchmarkdotnet.org/, a powerful benchmark tool to compare your different versions of implementation.
sample code:
之前我研究了一下使用SpyObject来测试NGRX,但这种方法有一个缺点:
You need to mock everything of the spyObject like pipe(), select(), etc. But actually, we may want to test with the real implementation of store, appState, action and selector.
Assuming we have
export const appReducers: ActionReducerMap<AppState, any> = {

    feature1: feature1Reducer,

    feature2: feature2Reducer

};


export class ChangeExpandedState implements Action {

  readonly type = Feature1ActionTypes.CHANGE_EXPANDED_STATE;  // action enum used in reducer,this is old, use https://ngrx.io/api/store/createReducer instead

  constructor(

    public payload: { section: string; subSection?: string; id?: string | null }

  ) {}

}


export function feature1Reducer (state = initialFeature1State, action: Feature1Actions): feature1State {

  switch (action.type) {

    case Feature1ActionTypes. Feature1_LIST_CHANGE:

      return {

        ...state,

        feature1List: action.payload.updatedFeature1List

      };

    ……

    case Feature1ActionTypes. CHANGE_EXPANDED_STATE:

                 const expandBuilder = state.expandState;

   // do something to flipflop based on action.payload.section

  return {

    ...state,

    expandState: expandBuilder

                };

   }

}
In test spec file’s async beforeEach:
TestBed.configureTestingModule({

            imports: [

                StoreModule.forRoot(appReducers),

             …]

         …..

}).compileComponents();

testStore = TestBed.get(Store);
测试用例:
it('should subscribe to someActionState change, () => {

    expect(component.isSomeActionEnabled).toBeFalsy();

    component.isActionSuccess = true; // showing the action response

    testStore.dispatch(new ChangeExpandedState({ section: "someAction" }));

   expect(component.someFeatureEnabled).toBeTruthy();

    expect(component.isActionSuccess).toBeFalsy(); // clear last time response

    testStore.dispatch(new ChangeExpandedState({ section: "someAction" }));

    expect(component.isSomeActionEnabled).toBeFalsy();

});