JB’s dot trace performance profiler is part of its dot ultimate suite(which includes the famous resharper)
the simplest way to use it is to attach to your already running process(the same setting can be reused next time), and check the “collect profiling data from start”, then hit run before the slow performance happens, then take a snapshot as soon as the slowness ends.
then go to the hot spots or just functions list, order by time.
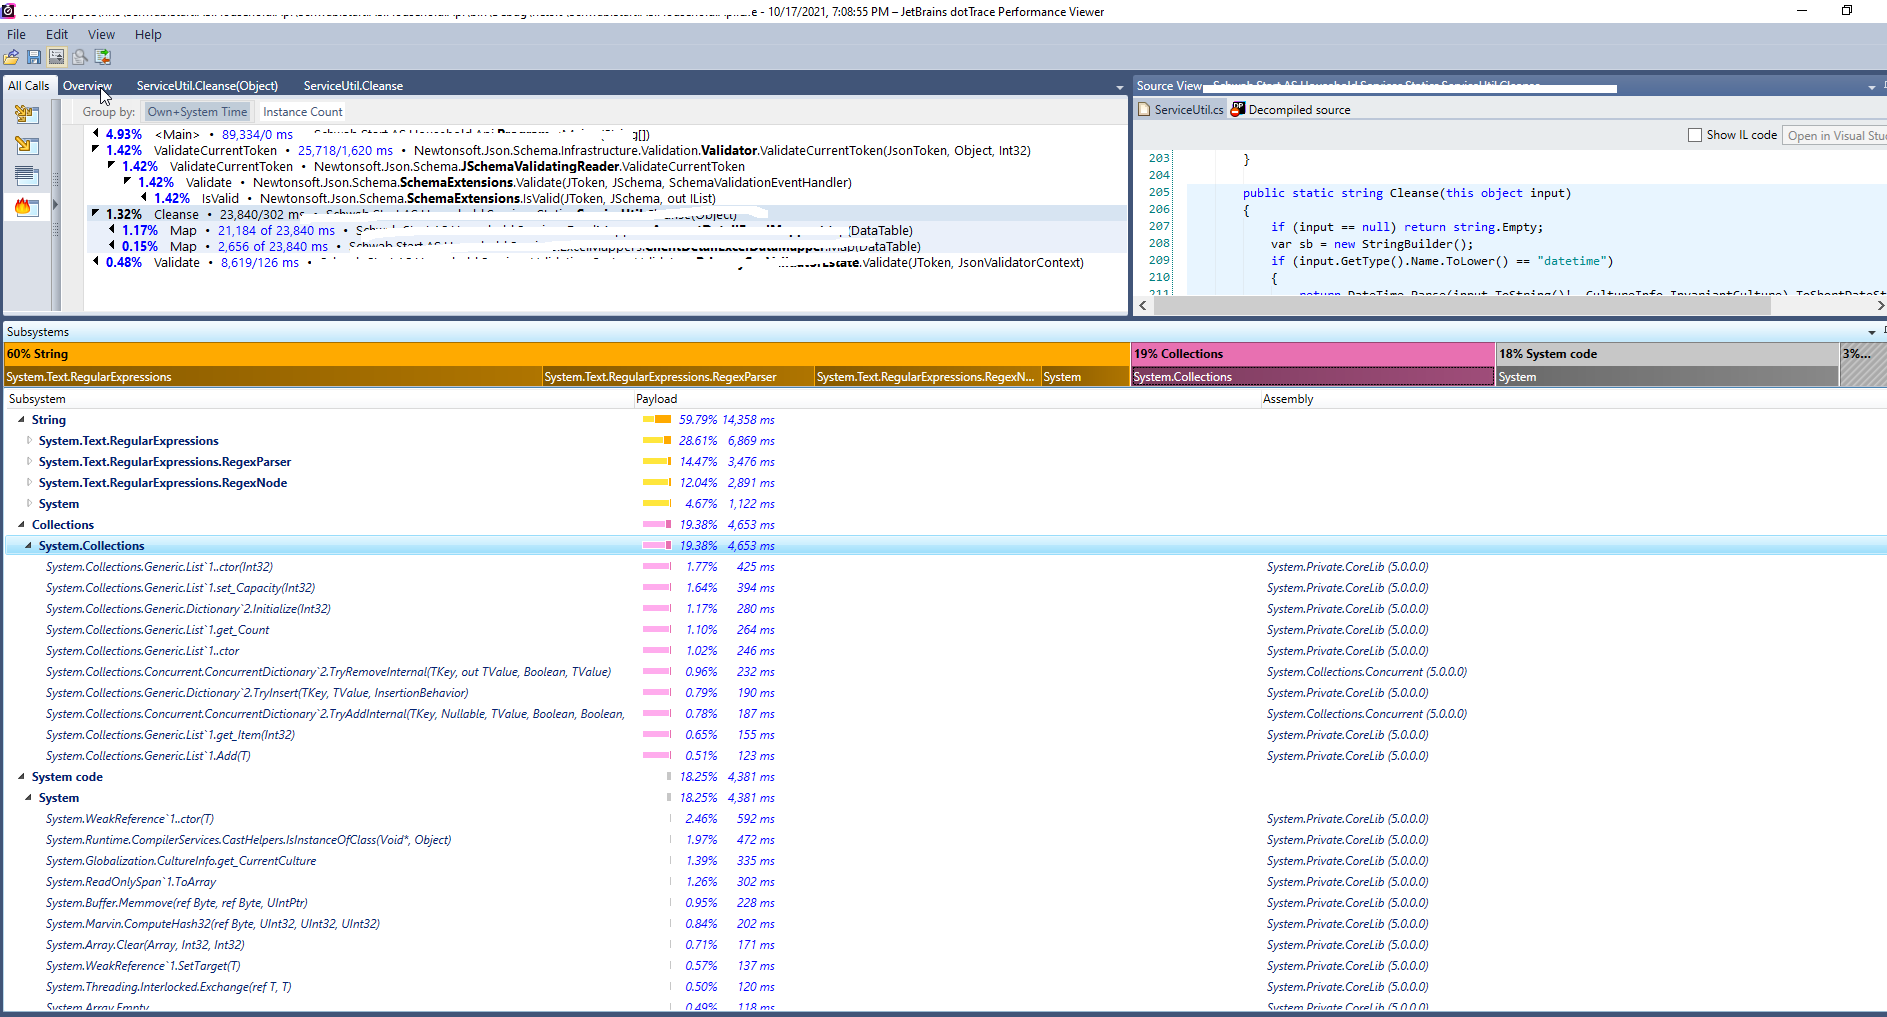
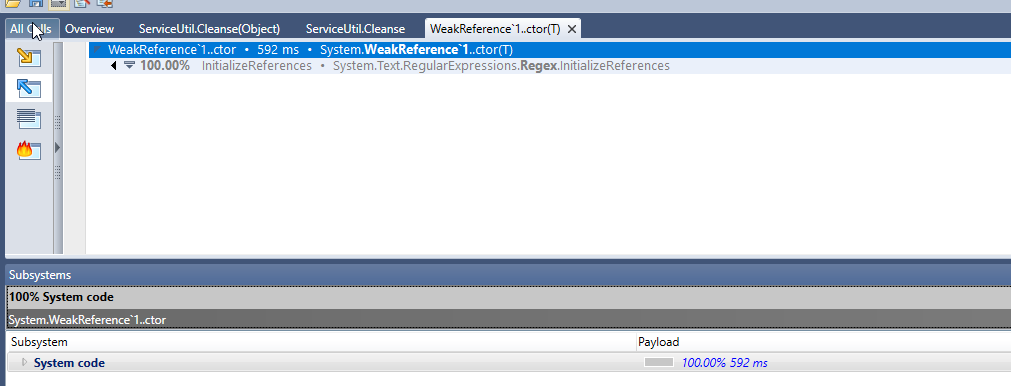
it will give you where the slowness happened, and even system code that ran slow can be dug into who called them.
then you can use https://benchmarkdotnet.org/, a powerful benchmark tool to compare your different versions of implementation.
sample code: